T19IceLossMethod
A standardized method for assessment of production losses due to icing from wind turbine SCADA data
An open source Python code has been developed by Task 19 as a reference implementation of the method. The software and it’s documentation is available for download on Github.
Motivation
Currently, production losses due to wind turbine rotor icing are calculated with different methods, all resulting in different results. Task 19 has three main reasons why a standardized production loss calculation method is needed:
- There is a large need to compare different sites with each other with a systematic analysis method
- To validate the IEA Ice Classification
- Evaluate the effectiveness of various blade heating systems
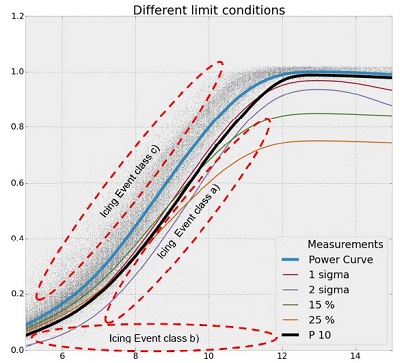
Current production loss methods usually use a constant -15% or -25% clean power curve drop as an indication of icing. Similarly, standard deviation (or multiples of it) has been widely used to define iced turbine production losses (Figure 1). Both of these methods result in different results and are not necessarily representing the actual ice build-up and removal process to wind turbine blades reliably enough.
With the method described here, anyone with access to SCADA data from wind turbines can assess and calculate turbine-specific production losses due to icing. The standardized method will use existing standards and will be developed in order to minimize the uncertainties related to production loss estimations from SCADA data. The method does not require icing measurements as input.
Method
Task 19 proposes a method that is robust, easily adaptable, filters outliers automatically, and does not assume a normal distribution of the SCADA data for individual turbines and wind farms.
The proposed method uses percentiles of the reference, non-iced power curve in combination with temperature measurements. Ice build-up on turbine blades gradually deteriorates the power output (or results in overproduction to the iced anemometer) so for increased accuracy, the method uses three consecutive 10-minute data points for defining start-stop timestamps for icing events.
In other words, the turbine rotor is used as an ice detector. Iced turbine power losses are defined by comparing the performance to the calculated power curve using heated anemometers from the nacelle and the measured reference, the expected power curve. Production losses are separated into 2 categories: operation and standstill losses due to icing.
On a general level, the method can be divided into 3 main steps:
- Calculate reference, non-iced power curve
- Calculate start-stop timestamps for different icing event classes
- Calculate production losses due to icing
Below is the list of required SCADA data signals used as input for the production loss calculation method.
Disclaimer
The Software is provided “AS IS” and VTT makes no representations or warranties of any kind with respect to the Software or proprietary rights, whether express or implied, including, but not limited to merchantability, fitness for a particular purpose, and non-infringement of third party rights such as copyrights, trade secrets or any patent.
VTT shall have no liability whatsoever for the use of the Software or any output obtained through the use of the Software by you.
Method Table 1.
List of required SCADA data signals for standardized production loss method due to icing.
| Signal | Description | Unit | Value |
| ws | Heated nacelle wind speed |
m/s | 10-minute mean |
| temp | Ambient temperature (from nacelle weather mast) |
°C | 10-minute mean |
| pwr mean | Turbine output power | kW | 10-minute mean |
| nacdir | Nacelle yaw angle | deg | 10-minute mean |
| mode | Turbine operational mode | – | 10-minute mean |
Any Question at
Tel: +xx xx xx xx
VTT
Technical Research Centre of Finland Ltd
Kivimiehentie 3, Espoo
Finland
Monday to Friday
9 am – 17 pm Central European Time
Send your mail at
timo.karlsson@vtt.fi