About Task 47
The aim of IEA Task 47 is to cooperate in the field of detailed aerodynamic measurements on MW scale wind turbines. Such measurements are extremely difficult to do and the only public example until now is the Danish DanAero experiment which was used in IEA Task 29. Recently several other countries initiated new experiments for turbines up to a scale of 8MW and they now all have to go through a similar learning process on these new measurement techniques. Sharing experiences is then a very fruitful way to steepen the learning curves.
The Task also includes analysis of aerodynamic measurements where moreover simulations are carried out on the 15 MW Reference Wind Turbine from IEA Task 37. These simulations give insight into the relevant aerodynamic problems for large-scale wind turbines which is important information for the definition of the experimental programs.
The Operating Agent of the Task is TNO in the Netherlands, with support from DTU in Denmark.
Participation
Task 47 Participants
The following countries with institutes participate in IEA Task 47 Turbinia
- Denmark: Technical University of Denmark (DTU), Siemens- Gamesa Renewable Energy
- France: Ecole de Nantes (ECN), ONERA, IFP Energies Nouvelles
- Germany: Forwind/Fraunhofer IWES, University of Stuttgart (IAG), Kiel University of Applied Sciences, WINDnovation, German Aerospace Center DLR, Enercon, UAS Emden/Leer
- Italy: CNR-INM, PoliMi, University of Rome “La Sapienza” University of Rome “Roma Tre” – University of Florence, Politecnico di Bari
- Netherlands: Netherlands Organisation for Applied Scientific Research (TNO), CWI, Delft University of Technology, Suzlon Blade Technology (SBT), Det Norske Veritas (DNV), LM, University of Twente
- Sweden: Uppsala University Campus Gotland
- Switzerland: Eastern Switzerland University of Applied Sciences (OST)
- United States: National Renewable Energy Laboratory (NREL)


Who can participate in Task 47?
To participate in the research activities of Task 47, researchers must reside in a country that participates in the IEA Wind Agreement AND has agreed by official letter to participate in Task 47. The participating member country of the IEA Wind TCP must designate a lead institution that agrees to the obligations of Task participation (pay the annual fee and agree to perform specified parts of the work plan).
Active researchers (performing part of the work plan) benefit from meetings and professional exchange during the term of the Task. In the particular case of IEA Task 47, the measurement results will, where possible, be shared with the consortium so that partners get first-hand information from unique new data. Countries participating in the Task benefit from the information developed by the Task. The value of the research performed is many times the cost of the country participation fee or the labor contributed to carrying out the work plan.
For more information, contact the Operating Agents, Gerard Schepers, and Koen Boorsma, or the IEA Wind Secretariat.
Operating Agents
Please contact the Operating Agents below with any questions


Task 47 Publications
Find more information about our publications and results in the publication tab or the link below
A use-case-driven approach for demonstrating the added value of digitalisation in wind energy
A use-case-driven approach for demonstrating the added value of digitalisation in wind energy
Task 43 PublicationsTask 47 Roadmap
The Task 47 begin date is January 1st, 2021 after which it runs for 4 years until December 31st, 2024. Detailed planning of the activities can be found under the tab Work Plan and Objectives but roughly speaking the following main activities can be distinguished:
- Cooperation in new aerodynamic experiments. Experiences gained with this specialized form of measurement are being shared and documented.
- Calculations on the DanAero experiment. The calculations are done in 2 rounds, the first round started in 2021. A comparison was made on basis of statistical properties but also on a time series basis where special emphasis was put on a consistent comparison between calculations and measurements. A second round started in 2023 at sheared conditions, for which some modelling issues are believed to be the reason for differences found in the first round.
- Calculations on 15 MW RWT, where a mutual comparison of low fidelity results with high fidelity results is made. This started with a check on the model description. Thereto the input for the 15 MW RWT has been prepared for both lifting line and CFD codes and results are checked. In 2023 calculations are done at turbulent conditions.
- Eventually, the results of the project will be evaluated and it will lead to recommendations on model improvement and best practices in detailed aerodynamic experiments
More information can be found here.
Start up of cooperation between parties that perform detailed aerodynamic measurements. Several challenges have been identified and experiences/solutions to these challenges are sought. Thereto several meetings/workshops have been organised.
A first calculational round on the DanAero turbine at turbulent conditions was carried out and evaluated. A mutual comparison was made between results from low-medium and high fidelity codes but also between calculational results and measurement results.
The IEA 15 MW Reference wind turbine has been modelled in a variety of codes (both lifting line and CFD) and calculations have been done under simple steady and uniform conditions. The comparison between model results forms a check on a correct model input.
Roughly speaking the planning for the remaining period is as follows:
The cooperation between parties that perform detailed aerodynamic experiments will be strengthened. Where possible experimental data are shared within the project group. Best practices for doing detailed aerodynamic experiments are documented in an "aerodynamic measurement recommendation" document.
The first round of calculations on the DanAero experiment showed differences which are partly attributed to the challenges which BEM have in modelling the induction for non-uniform conditions. These challenges obviously become more prominent with increased size.
In 2023 a sheared cases will simulated and the the comparison between BEM and higher fidelity codes is expected to shed light on the best modelling practice.
Now the input for the IEA 15 MW Reference Wind Turbine has been established a turbulent case will be simulated where it is anticipated that several rounds are needed so that it covers the time span until the end date (December 2024).
In the last Quarter of 2024 a final report will be made.
Frequently Asked Questions
Get answers to our most commonly asked questions about IEA Wind TCP Task 47
Why do we need detailed aerodynamic measurements?
Specific aerodynamic measurements are needed to understand the very large challenges of the aerodynamics of large wind turbines in the atmospheric flow. These measurements only can capture the details of the flow physics.
Detailed aerodynamic measurements are even an absolute necessity when validating wind turbine design codes since a comparison with conventional measurements of global (rotor) blade loads is far too crude and it does not provide the accuracy of such codes. This is due to the fact that a good agreement between calculated and measured rotor (blade) loads is often caused by compensating errors (e.g. an overprediction at the root can be compensated by an underprediction at the tip or an overprediction in lift can be compensated by an overprediction in drag). In such cases, a comparison with global load measurement yields a good agreement and the very misleading conclusion that the code is accurate. An example is given in the figure from IEA Wind Task 18.
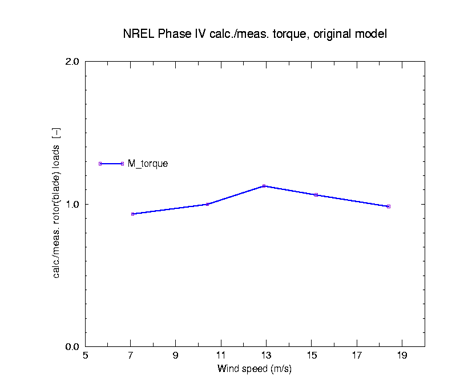
The ratio between ECN calculated and NREL Phase IV measured rotor shaft torque as a function of wind speed
It shows the ratios between the rotor shaft torque calculated by TNO (ECN at that time) in comparison to measurements from the NREL Phase IV experiment as a function of mean wind speed. A ratio of 1 implies a perfect agreement (i.e. the target value). A ratio > 1 implies an overprediction and a ratio < 1 implies an underprediction. The comparison is generally very good with the largest discrepancy being 10% at roughly 13 m/s and discrepancies at other wind speeds which are often 5% or even less. Hence in the conventional case where rotor shaft torque (or power) measurements would be available only, the conclusion is that the code is performing well. However the measurement of pressure distribution at 5 radial positions as available in the NREL experiment offers a much more detailed validation see the following figures,
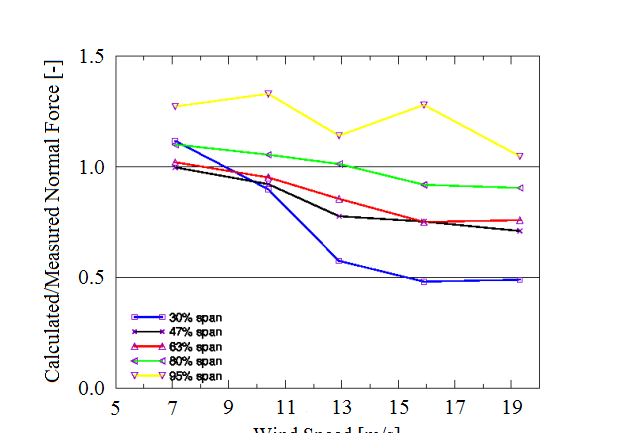
The ratio between ECN calculated and NREL Phase IV measured normal force as a function of wind speed at 5 radial positions
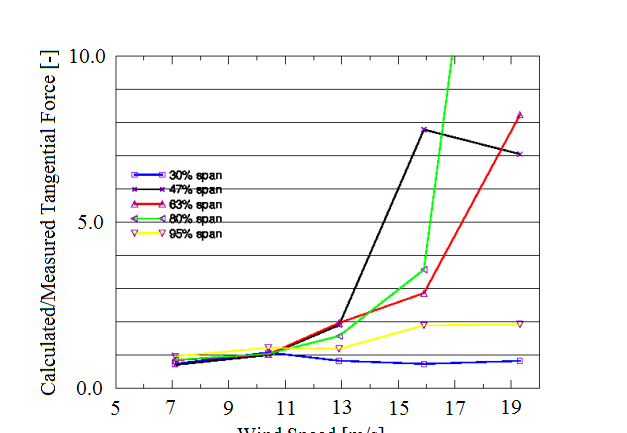
The ratio between ECN calculated and NREL Phase IV measured tangential force as a function of wind speed at 5 radial positions
These figures show the comparison of sectional forces in the normal and tangential direction. It is then very striking to see very large discrepancies (tens of percent) between calculations and measurements in particular at the higher velocities. This shows that the good agreement between calculated and measured rotor shaft torques is a result of compensating errors and the quality of the calculational code was not good at all! This clearly proves that the validation and improvement of aerodynamic models need detailed aerodynamic measurements and cannot be based on global loads.
More information can be found in G. Schepers Engineering models in aerodynamics, PhD thesis, November 27th, 2012, Technical University of Delft, Netherlands https://repository.tudelft.nl/islandora/object/uuid%3A92123c07-cc12-4945-973f-103bd744ec87
What are the specific benefits of the IEA Tasks on aerodynamics?
A first benefit that should be mentioned is the fact that an IEA Task offers a platform to share experiences and knowledge in the very specialized field of aerodynamic modeling and measurements. All participating bodies in the previous aerodynamic IEA Tasks (14, 18, 20, 29) acknowledge that this leads to huge mutual benefits with enhanced knowledge levels at all parties.
These shared insights and analyses from the Task partners improved the quality of the various experimental databases after which these databases could be provided as high-level validation material for design codes to a countless number of partners in the IEA Tasks but also to third parties all over the world. This holds for the field measurements taken in IEA Tasks 14/18, the NASA-Ames wind tunnel measurements from Task 20, the Mexico wind tunnel measurements from Task 29, and the DanAero field measurements from Task 29. The resulting knowledge of uncertainties in design calculations from these validations helps designers to assess the validity of their design calculations and allows standardization bodies to recalibrate safety factors in design standards. The measurements also led to fundamental model insights and aerodynamic understanding which clearly supported the improvement of aerodynamic wind turbine models as implemented in design codes. This is illustrated by the proposition from [1] (i.e. a PhD thesis based on the results of IEA Task 14/18/20 and the first phase of Task 29)
“nowadays there isn’t a designer to find who would dare to design a wind turbine with the very basic aerodynamic modeling as applied in 1980’ [2)]”
More specifically the figure illustrates how knowledge of aerodynamics, together with knowledge of other disciplines, plays a role in assessing the cost of energy.
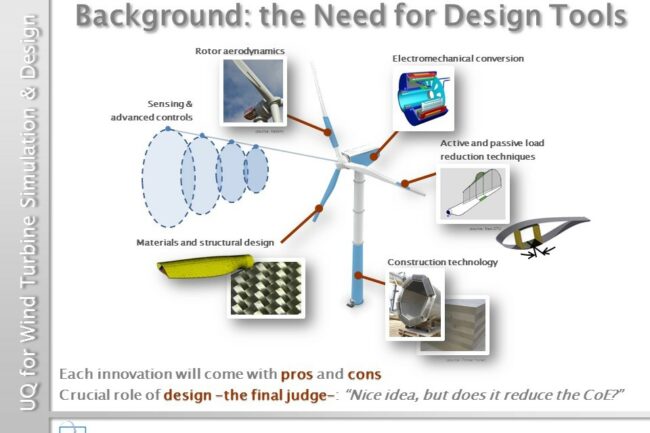
The role of design codes (and aerodynamics) in the assessment of LCOE (acknowledgment, Carlo Botasso, TUM)
The Levelised Cost of Energy (LCOE) of wind energy is largely determined by the performance and capital costs, where capital costs are directly related to turbine loading. Both performance and loading are predicted with higher accuracy from the improved aerodynamic models. The cost model of FP7 INNWIND.EU shows that a combination of a 5% increase in energy yield with a 12% decrease in the design loads of the turbine critical components and offshore substructure leads to a 10% LCoE reduction (conservative estimate). It is also important to realize that recommendations on optimal blade design and blade innovations, e.g. the optimal choice of airfoils or application of blade add-ons are important means for reducing the LCoE. These optimizations and innovations can only be successful if the blade aerodynamics is understood.
[1] Schepers J.G. Engineering models in aerodynamics, PhD thesis, November 27th, 2012, Technical University of Delft, Netherlands
[2] Van Grol, H.J, Snel, H, Schepers J.G.(1990)European Wind Turbine Benchmark Exercise on Mechanical Loads, WTBE/ML, Energy Research Center of the Netherlands, ECN
Why do we need aerodynamic research on wind turbines?
It should be realized that upscaling turbines towards saying 200-300m in diameter is the most promising way to reduce the cost of energy, in particular for offshore applications. This upscaling is possible only under the condition that such enormous rotors are feasible from a technical and economic point of view. However, these huge rotor-blades are an enormous scientific and design challenge in particular due to the uncertainties from the aerodynamics. The results of the FP7 AVATAR project have shown that the lack of coherence and the larger shear and veer which are inherent to those large wind turbines) challenge the modeling of aeroelastic response. An illustration of a modeling challenge is given in the figure below. It gives the extreme veer (i.e. the variation in wind direction with height) over the year 2015 at the location of Met Mast IJmuiden in the Dutch part of the North Sea. It shows that the maximum veer over the rotor plane of a 10 MW rotor (with a diameter of 220 meters) this year is approximately 40 degrees! The modeling of such a large veer heavily violates the assumptions in the BEM theory (the aerodynamic workhorse of industry). As a matter of fact, BEM assumes no yaw misalignment at all and definitely no large variation of yaw angle over the rotor plane.
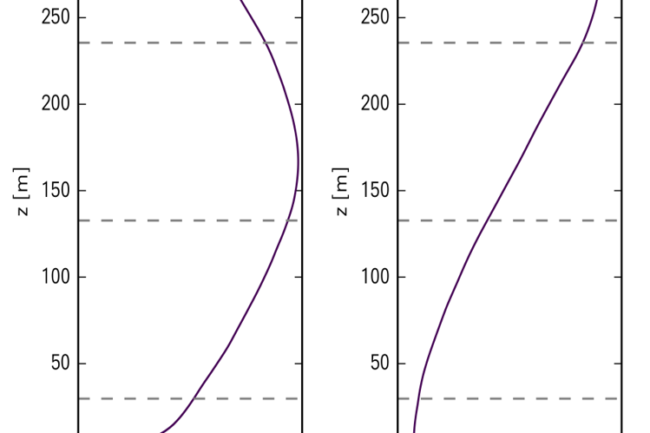
Shear (left) and extreme veer (wind direction as a function of height, right) from the year 2015 at the location of Met Mast IJmuiden in the North Sea (dashed lines indicate lower and upper part of rotor plane and a hub height of 10 MW turbine), from [2]
Moreover, this huge size in itself adds complexity through large blade deflections and the need for thick airfoils which are very difficult to model. Task 47 will overcome these challenges so that these large wind turbines can become a reality indeed as a means to reduce the costs of Energy. Apart from that a thorough understanding of aerodynamics and aero-elastics straightforwardly reduces the Levelized Cost of Energy LCOE due to better load and performance predictions. As a conservative estimate, a 10% reduction in LCOE is possible from better aerodynamic models.
Finally, the remark should be made that the history of wind energy aerodynamic research is still very young (say 30 years). Aerodynamic research in adjacent areas like airplane aerodynamics (or car aerodynamics) has a much longer history (> 100 years), see the figure.

Incomplete airplane aerodynamics even after decades of research (Acknowledgment, Gijs van Kuik, TUDelft)
This is not surprising since aerodynamics is a millennium prize problem, i.e. a problem which at the end of the last millennium was believed to be so complex that a significant part of the present millennium will be needed to solve it
[1] G. Schepers et al Final report of the EU project AVATAR: Aerodynamic modeling of10 MW turbines February 2018, http://www.eera-avatar.eu/publications-results-and-links/
[2] Schepers, J.G.; van Dorp, P; Verzijlbergh, R.; Jonker, H (2020) Aero-elastic loads on a 10 MW turbine exposed to extreme events selected from a year-long Large-Eddy Simulation over the North Sea Wind Energy Science, https://doi.org/10.5194/wes-2020-1
.
Why did Task 47 shift focus from field measurements to wind tunnel measurements and now back again to field measurements?
In principle measurements in the field would be preferred above wind tunnel measurements, since such measurements can be done on representative full-size turbines which avoids the inevitable scaling effects in a wind tunnel environment. Moreover, the atmospheric conditions are representative of the conditions which are experienced on a commercial wind turbine. Still, this stochastic atmosphere, though representative, makes interpretation of results complicated due to the unknown instantaneous inflow in the rotor plane which is the reason why wind tunnel measurements are important too. The stationary, known, and homogeneous wind tunnel conditions facilitate the interpretation of measurement results and make it possible to detect very subtly and small, briefly lived aerodynamic structures and events. In general terms, it should be concluded that there are pros and cons to both wind tunnel and field measurements. The best remedy to overcome these drawbacks is to combine the insights from full-scale field measurements with those from wind tunnel measurements. In other words, it is not wind tunnel measurements OR field measurements but it is wind tunnel measurements AND field measurements. In a sound scientific approach, these measurements need to be complemented with theoretical results.
It should also be noted that measurement techniques have progressed in the last decades. This is among others true for the measurement of inflow where modern (LIDAR) measurement techniques give much more detail on the rotor inflow than the mast wind measurements in IEA Tasks 14/18. Moreover partners in the IEA Task work on the development and application of new innovative (pressure) sensors that were not available at the time of IEA Task 14/18.
How is the cooperation with other IEA Tasks ensured?
In the predecessor project, IEA Task 29 several instruments were employed to ensure communication. It even resulted in a separate Work Package ‘Communication to other IEA Tasks’. The most successful cooperation was found to be the appointment of activity leaders who participate in other IEA Tasks as well. This even led to a common Benchmarks on aero-acoustics with IEA Task 39 ’Silent wind turbine and a common Benchmark with Task 30 on the so-called Unaflow measurements. Through these benchmarks, aerodynamic insights from Task 29 are fed into other IEA Tasks. Similar instruments will be employed in IEA Task 47.
You use a lot of acronyms, Mexico, New Mexico, Mexnext, what does it all mean?
The Mexico project was carried out in 2006. It stands for Measurements and Experiments in Controlled Conditions. It was an EU project in which detailed aerodynamic measurements were carried out on a 4.5-meter diameter wind turbine placed in the German-Dutch Wind Tunnel DNW. From the beginning, this experiment was intended to be done in 2 shifts so that lessons learned from the first shift could be taken into account in the second shift. Budgetary constraints made that the second shift could be done in 2014 only. The name New Mexico was then found to be a funny name for this second shift.
Mexnext refers to the phases 1 to 3 of IEA Task 29. It should be known that the Mexico and New Mexico project stopped as soon as the measurements were collected and there was no room to dive into the data. Therefore the analysis of data was done in a large cooperative effort within Task 29. As such Mexnext can be read as the follow-up(NEXT) activity of the (New)MEXico experiment.
Any Question at
Tel: +xx xx xx xx xx
Organisation
Street address
Postal code
Country
Monday to Friday
9 am – 17 pm Central European Time
Send your mail at
gerard.schepers@tno.nl
or
koen.boorsma@tno.nl